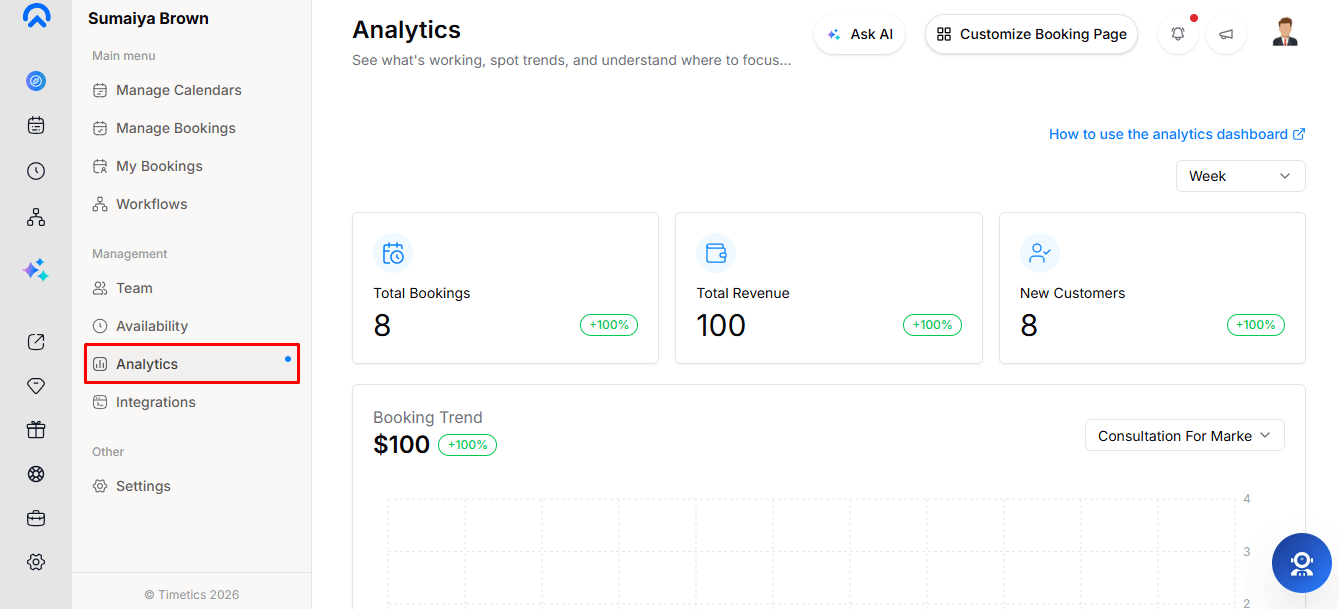
The Timetics AI Analytics Dashboard helps you track bookings, revenue, customers, booked hours, and calendar performance from Dashboard → Analytics.
You can view analytics by Week, Month, or Year, with each period compared to the previous equivalent period.
Why Do You Need It?
- Track booking and revenue performance.
- Compare new and returning customers.
- Monitor booked hours.
- Identify your best-performing calendars.
- Review cancellation rates.
How to Use Analytics
- Check Most Booked Calendars to compare revenue, bookings, attendees, and cancellations.
- Go to Dashboard → Analytics.
- Select Week, Month, or Year to compare performance with the previous period.
- Review Total Bookings, Total Revenue, and New Customers in the stat cards.
- Check the Booking Trend chart and filter by calendar when needed.
- Use Order Summary to compare new and returning customer revenue.
- Review Hour Analysis to see total booked time.
Key Functionality
- Confirmed Bookings: Only confirmed in-app bookings are counted.
- Revenue: Only the amount actually paid is included.
- Customer Type: Customers are identified by their booking email.
- Cached Results: Recent bookings may take some time to appear.
- Basic Reporting: Includes bookings, revenue, and new customers.
- Advanced Analytics: Includes trends, order summary, booked hours, and top calendars.
Important Notes
- Analytics uses calendar-aligned periods, not rolling date ranges.
- Revenue from different currencies is added without currency conversion.
- Most Booked Calendars displays a maximum of five calendars.
- Cancellation rates include cancelled bookings.
- Analytics data may not update immediately because results are cached.